Brief Introduction
This is a debugger for J2ME. Jmdb emulates the user interface of GNU Gdb. The features of Jmdb are:
- It has a command-line interface and an Emacs interface.
- It can remember the commands which is previously inputted (just like the command history in Gdb) in command-line mode. In order to use the previous commands, you have to press ‘arrow up’ or ‘arrow down’ keys to look-up.
- Jmdb uses the ‘comint’ mode built in the GNU Emacs when using the Emacs mode to accomplish the command history function.
- It comfirms to the UNIX locale standard: i18n.
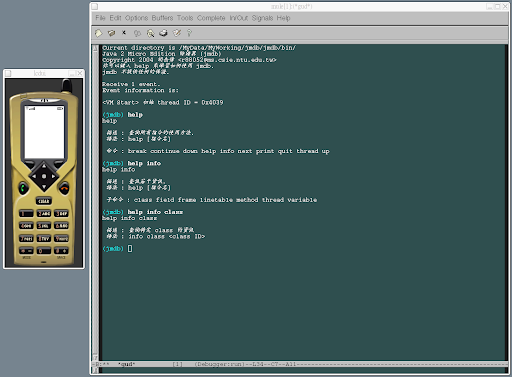
There are several commands you can use under the Jmdb:
- break ———- Install a breakpoint
- continue ———- Continue execuating
- down ———- Trace down 1 stack frame
- help ———- Print command help
- info ———- Print several information
- class ———- Print information of the specified class
- field ———- Print field information of the specified class
- frame ———- Print stack frame information of the specified thread
- linetable ———- Print line table of the specified method
- method ———- Print method information of the specified class
- thread ———- Print thread information in the whole Java VM or of the specified thread
- variable ———- Print variable information of the specified method
- next ———- Execuate to the next source line
- print ———- Print value of the specified variable.
- quit ———- Quit Jmdb
- thread ———- Thread operation
- resume ———- Thread resume operation
- all ———- Resume all threads in the Java VM
- suspend ———- Thread suspend operation
- all ———- Suspend all threads in the Java VM
- resume ———- Thread resume operation
- up ———- Trace up 1 stack frame
In addition, Jmdb has a function to automatically search the command. That is to say, the user only has to input a part of a command, and press the enter key. Then, Jmdb will smartly find the real command which the user would like to execute. For example, if a user wants to execute ‘quit’ command, then he just need to input ‘q’ (or ‘qu’ or ‘qui’) and press enter, and then the Jmdb will know that the user wants to execute ‘quit’ and quit the Jmdb eventually. I have another example. If a user wants to execute ‘help thread resume all’ to know how to use ‘thread resume all’ command, through the function of automatic decision of the commands in Jmdb, he just needs to input ‘h t r a’ to finish the longer command sequence ‘help thread resume all’. This function can be seen anywhere in Jmdb.
Besides, through the assistent of Emacs, Jmdb can achieve Java source level debugging. That is to say, when Java VM hits a pre-assigned breakpoint, the Emacs interface of Jmdb will show the corresponding Java source code of that breakpoint, and jump to the source line of that breakpoint. In addition, when we use Jmdb to examine the Java source codes, we can use ‘print’ command to show values of variables. We can also use ‘next’ to force Java VM to execute the next source line and stop, and use ‘up’ and ‘down’ arrow keys to examine the calling frames.
Packet Content
Jmdb includes a main program, and an elisp file for the Emacs interfcae, and a traditional chinese locale file.
System Requirement
Because Jmdb is written by the C++ programming language, and compiled by the GNU C++ Compiler version 3.3. Thus if you want to execute Jmdb, you needs:
- libstdc++.so.5
- libgcc_s.so.1
- GNU Emacs 21 (I don’t know whether Emacs version 20 can be paired with Jmdb, if you have answers, please e-mail me)
Screenshots
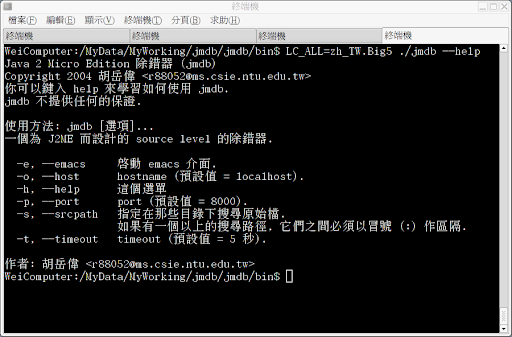
Jmdb command-line options
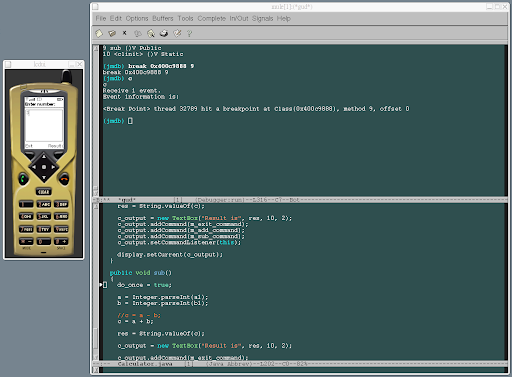
The Emacs interface of Jmdb
When Java VM hits breakpoints, the Emacs interfcae of Jmdb will show the corresponding Java source codes automatically.